Category/Color Analysis Report
This cross-tab report organizes sales by both category and color. The grid shows sales summary information (number of sales, average sale, and total sales) for each combination of category and color.

When to Use
Run this report to see which colors are selling the best across a specific set of categories.
How To Get To This Report
Reports > Analysis > Category / Color Analysis
- Go to Reports.
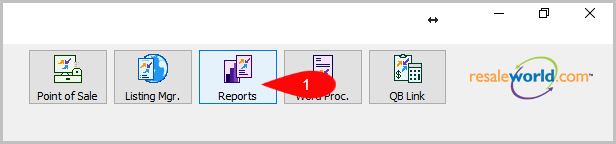
- Go to Analysis.

- Click on Category / Color Analysis.


How To Add More Criteria
1. Click on Add More Criteria.

2. Select the criteria you want and press OK.

Criteria Choices
- Account Number
- Brand
- Category 1
- Category 2
- Category 3
- Color
- Date Sold/Posted
- Filter Code
- Item Received Date
- Price Code
- Size
- Terminal ID
- Terminal Location
Next Article In Section
Click the following link to move to the next article in this section:
Category/Size Analysis Report
Related Topics
Category/Color Analysis Report Selecting the Right Report Account Productivity Report Brand Productivity Buyer Summary Report Category/Brand Analysis Report Category Productivity Category/Size Analysis Report Coupon Summary Report Gift Card Transaction History Report Historical Inventory and Obligation Report